ATF Gun Traces (U.S.)
The Bureau of Alcohol, Tobacco, Firearms and Explosives publishes summary data about the gun tracing it does on behalf of law enforcement.
Download
Details
Every year, the ATF traces hundreds of thousands of guns recovered by local, state, and federal authorities at crime scenes. While the ATF is legally barred from publicly releasing most trace information, the agency does publish summary data showing how many crime guns were recovered and traced in each state, the states in which those crime guns were first purchased, the types and calibers of those crime guns, and time-to-crime rates, among other information. You can use this data to analyze gun trafficking trends.
The data generally includes the 50 states, Washington, D.C., and U.S. territories from 2014-2023. (Guam and the Northern Mariana Islands are tracked together in a single field.)
Limitations
The ATF notes that traces represent those firearms recovered and traced during a calendar year, “or, if the recovery date was blank, the trace entry date was [during calendar year].” Duplicate trace requests, gun buybacks, and “firearms turned in” are omitted, per the ATF, and data comes via a query of the Firearms Tracing System during the subsequent year (i.e. 2023 data was queried on April 10, 2024.)
Individual tables
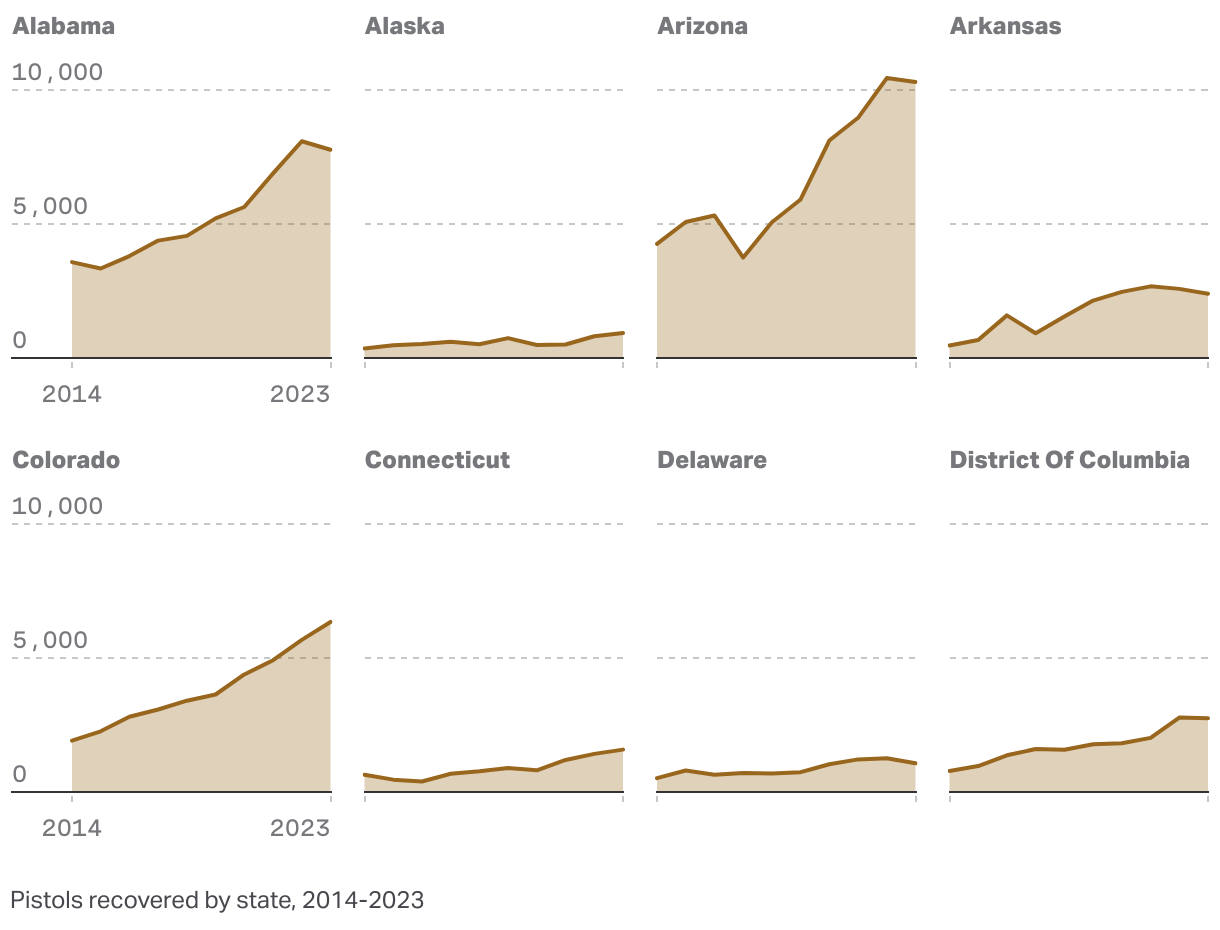
source_recovery_by_state.csv
The source and recovery state can be the same (and very frequently are). The ATF notes that “traces must identify a purchaser and the state in which the final dealer is located,” and so source states are not determined in every trace.
calibers_by_state.csv
A small share of the firearms traced by the ATF are not represented in the calibers data. You can check the footnotes in the original files to see the national number of additional calibers (in 2022 it was 4,456, less than 1 percent of all traces).
categories_by_state.csv
An ATF spokesperson told The Trace that, regarding the crime codes, “ATF consolidates into general categories the National Crime Information Center (NCIC) uniform codes.” The agency uses some, though not all, of the NCIC categories. For example, the NCIC categories for larceny, stolen vehicle, tax offense, and sexual assault are not present in the data.
timetocrime_by_state.csv
The individual Excel files posted by ATF have a footnote with the national average. The Gun Violence Data Hub has collected those and is sharing them in a table at the end of this section.
ttc_source_recovery_by_state.csv
Average time-to-crime will be empty when there was no firearm traced between the two states in a given year.
age_of_possessor.csv
The individual Excel files have a footnote with the national average. These can be found on the ATF website. In two older years of data (2014 and 2015) average age is sometimes a decimal, which is not the case in newer years, so caution is advised if comparing averages over time.
top_recovery_cities_by_state.csv
The data is not complete, it includes only the “top” cities. The number of cities for each state/year is not consistent (in other words, the ATF site lists the top 15 cities for Alabama in 2021, but only the top 10 in 2020). Generally, however, it includes 10 cities. The ATF reports that in some cases a recovery city is not determined. Top cities appear to be determined by comparing them to other cities within a given state, not across state lines (the tenth city for Texas reports considerably more firearms recovered than the top city for Hawaii). Older years of the data exist, but have not been scraped by The Trace at this time, partly because of the different format in which they are presented on the ATF website, in PDFs that have inconsistent formatting.

Methodology
The Trace collected 94 files worth of data from the ATF website in January 2025. We cleaned the data, reformatting the Excel files published by the agency by stripping away footnotes and unnecessary headers. We combined several years of data into tables that will allow users to examine trends across time.